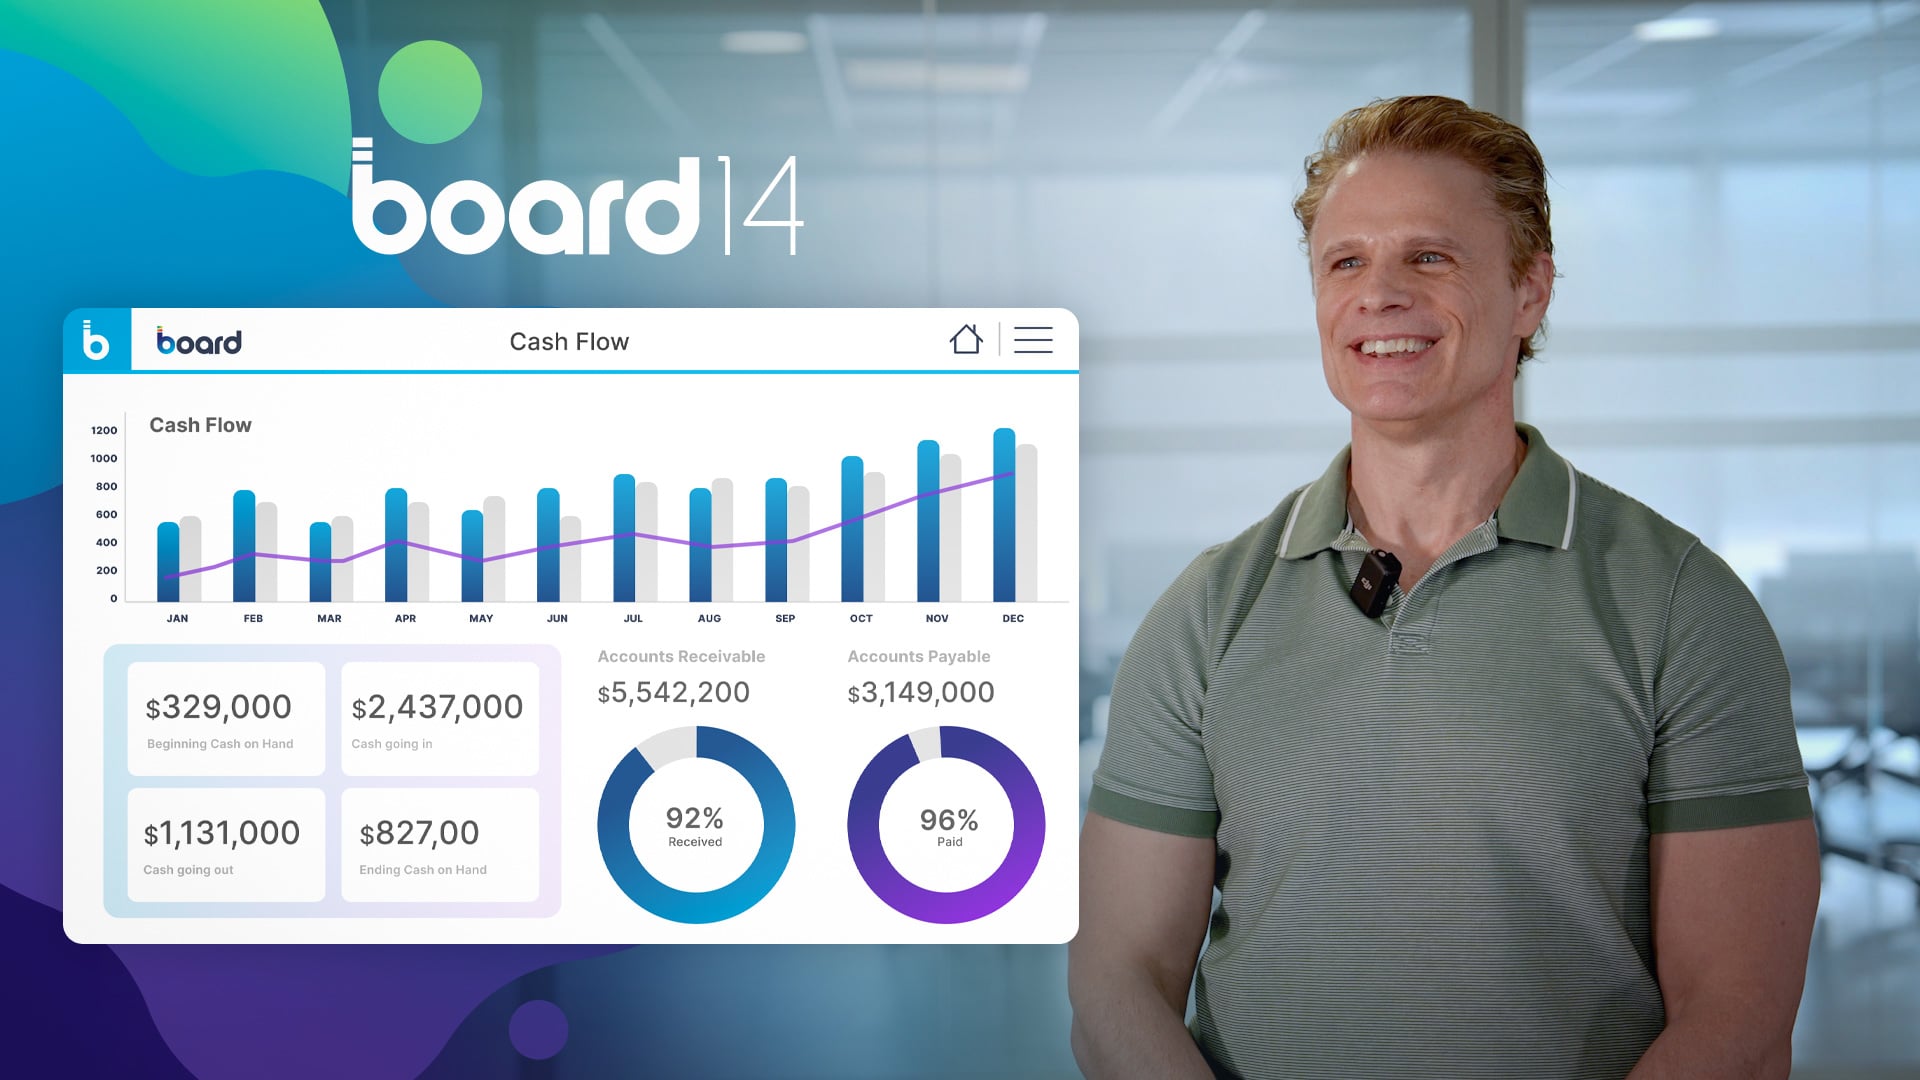
Your next breakthrough
starts here.
More intuitive. More streamlined. Faster than ever.
Self-Service Analytics
Quickly gather actionable business insights to inform the planning process
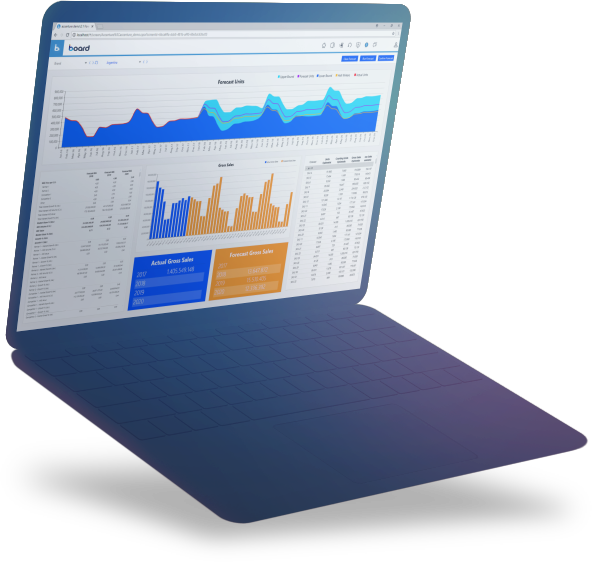
Board allows you to create compelling visual analyses and analytical applications from raw data in a matter of seconds, without the help of IT.
An innovative user environment that combines self-service data preparation, search-based data discovery, personal mash-ups, and drag and drop functionality gives you access to the right information easier, faster and more effectively, without compromising enterprise data governance. This unified self-service analytics platform ensures that users can gain meaningful insights from data in seconds.
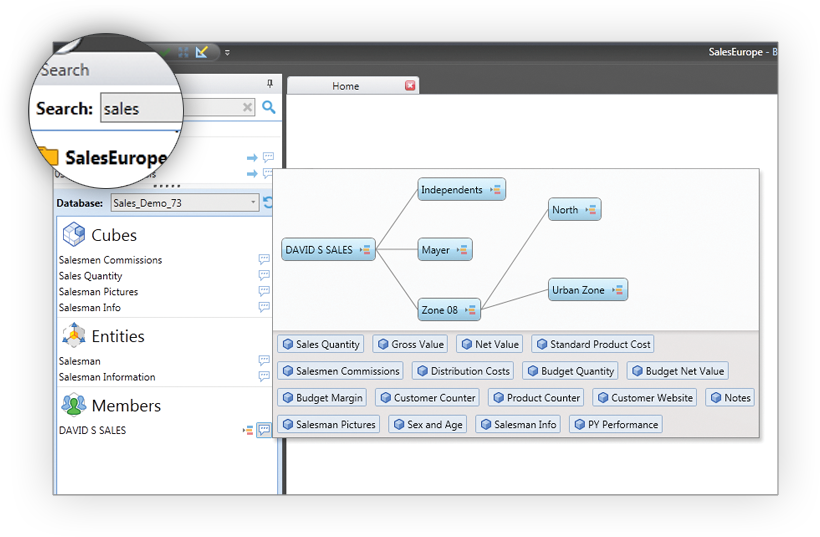
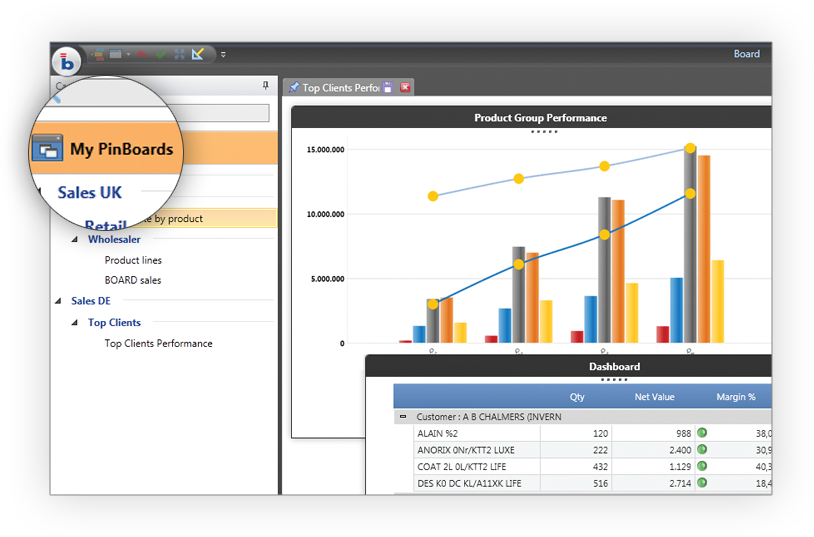
Always find the right information
Board’s interactive search functionality, which works across screens, data, metadata, and applications, allows you to find and explore information quickly and effectively.
As a single, unified solution, Board allows any search result to be used immediately as a driver for further analysis or as an element for creating new reports, through its drag and drop self-service user interface. After searching for a product name, for example, users can immediately choose a report where it is included and use the product or a correlated dimension as the selection criteria.
Intuitive drag and drop analysis
Enable end users to effortlessly create their own analyses or customize centralized reports on the fly with Board’s intuitive drag and drop interface.
A sliding panel makes measures and dimensions instantly available to users, who can choose values, set rows and columns, create calculated measures, run reports and get their own business insights at the speed of thought.

Easily upload, merge and model your data
Board’s new, self-service data import functionality, Smart Import, allows business users to easily load datasets from Excel files, instantly create data models, and immediately run visual analyses or build analytical applications without the help of the IT team.
Users can also enrich data models by merging multiple datasets and create additional calculations and formulas as well as rules to validate the data in an Excel-like environment.
Effectively organize your findings and create compelling stories
Choose any existing report, customize it, and include it in a presentation with additional commentary and analyses. Create personalized reporting books and add storytelling elements to present new findings and crucial insights.