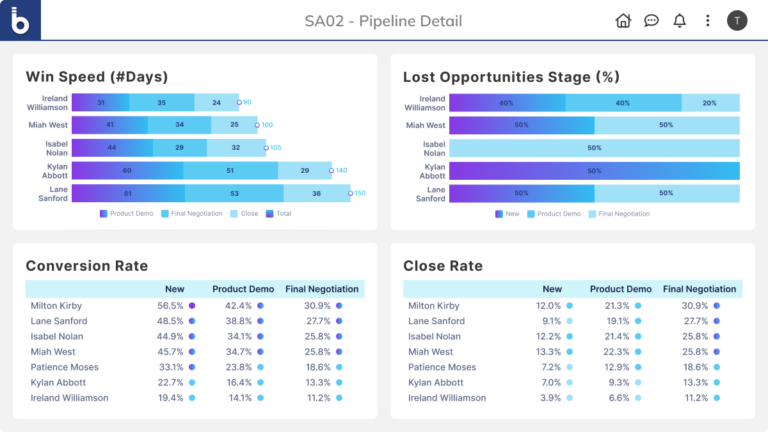
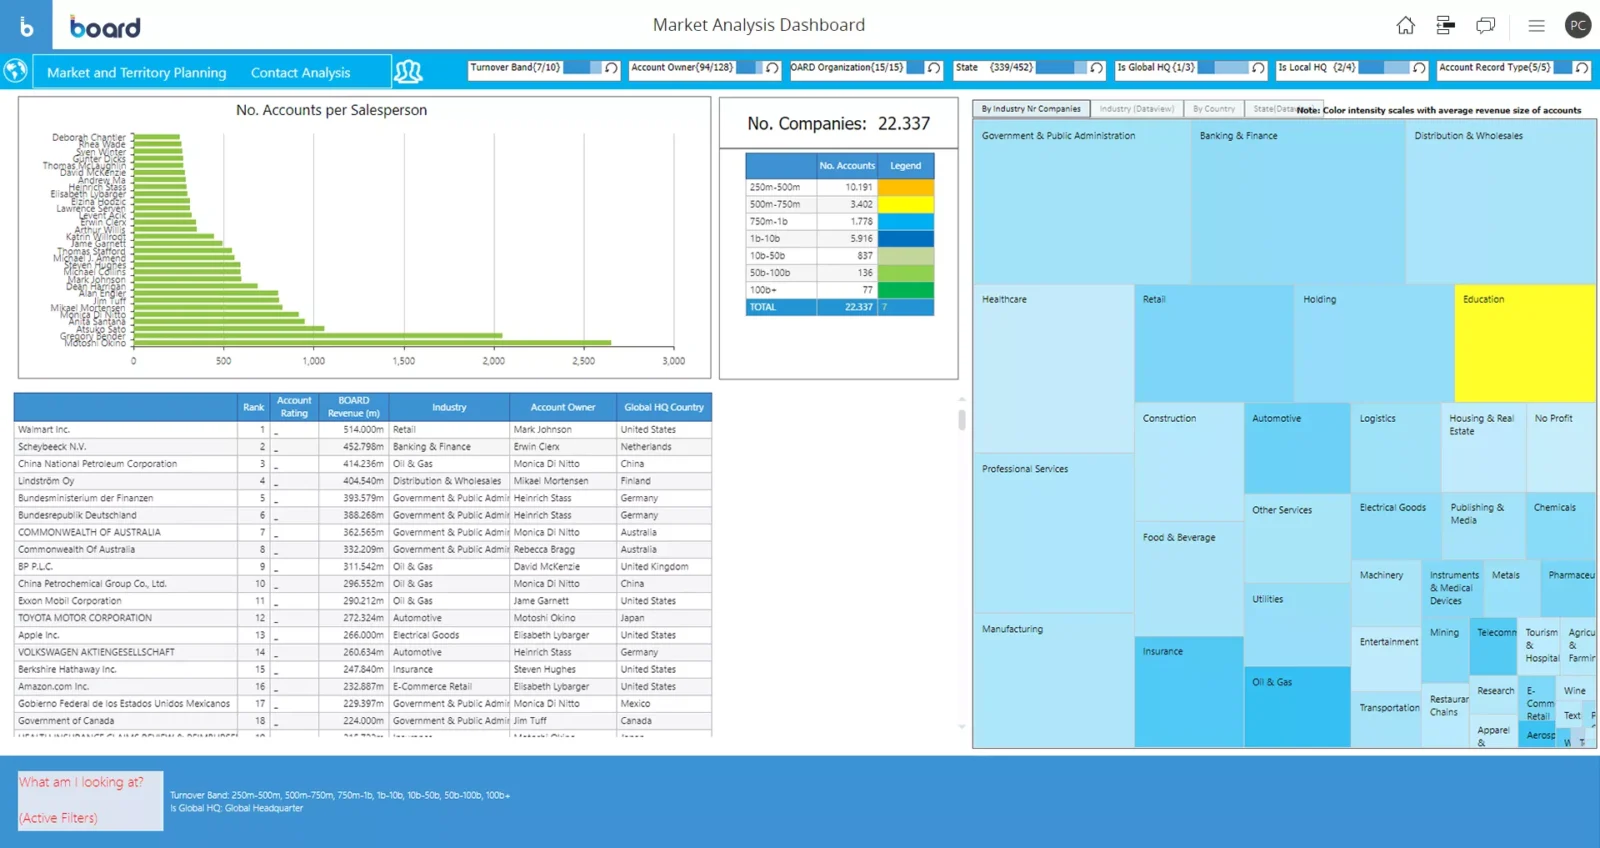
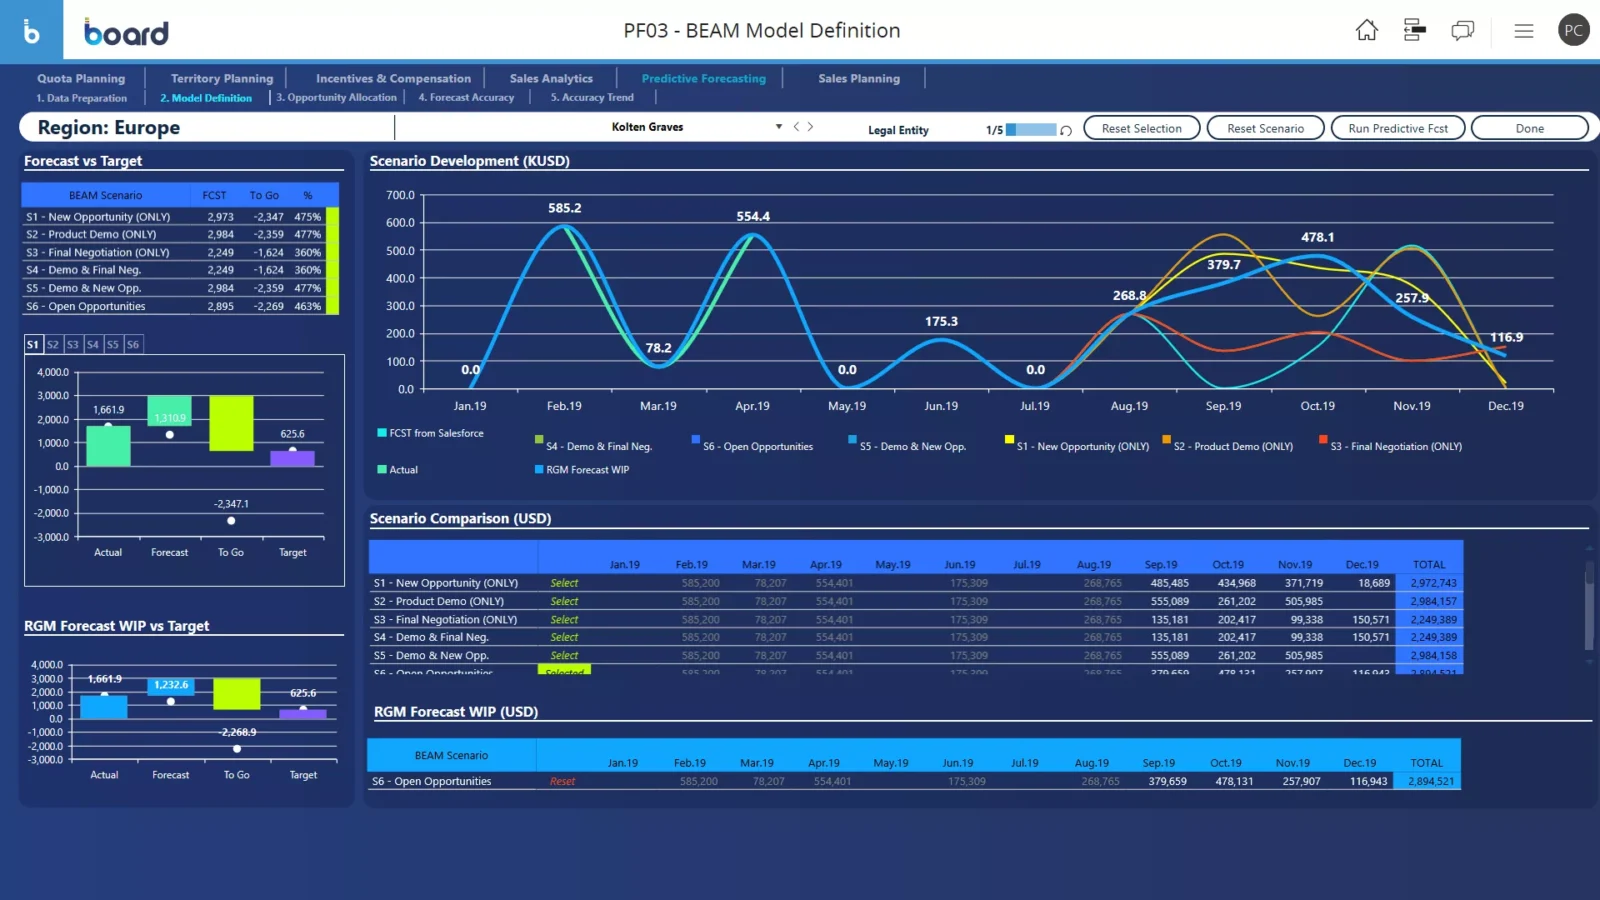
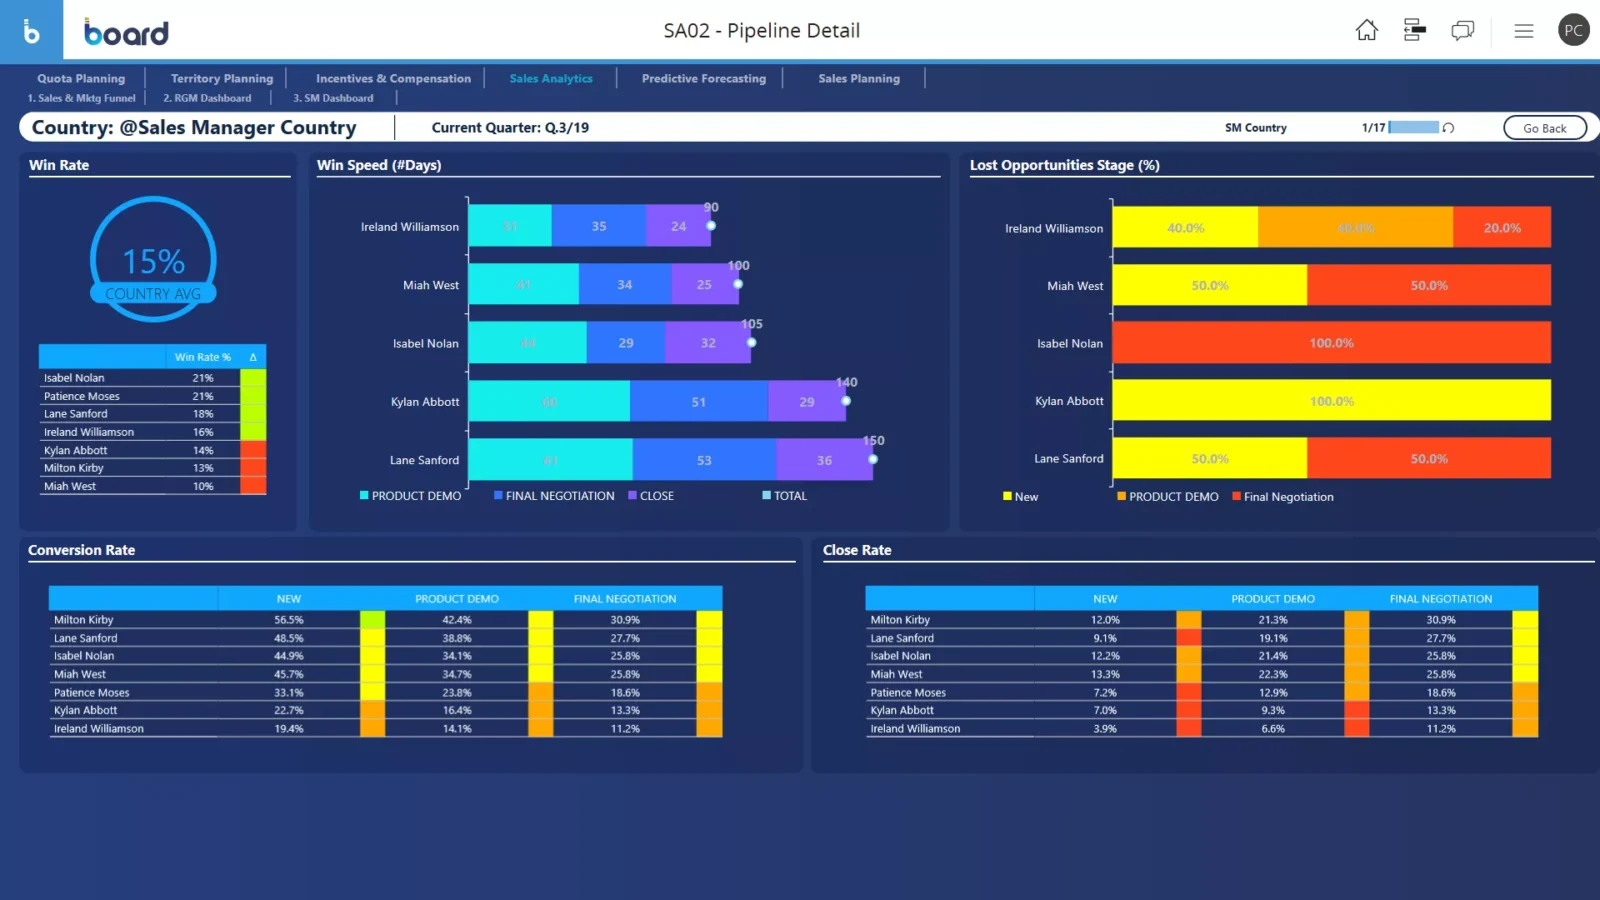
Sales

Sell smarter with effective sales analytics

Successfully lead your sales cycle, monitor sales performance, and manage your sales team

Gain greater visibility of the key value drivers underpinning the sales process, collect significant information relating to customers’ buying behavior, and thoroughly understand the evolution of sales opportunities with Board’s Intelligent Planning Platform.

Sales Analytics Image 1
The screen shows how the Sales & Marketing funnel can be represented in Board, enabling historical analysis

Perform detailed customer segmentation

Extract detailed insights about customers’ needs and preferences to produce accurate profiles of their behavior.

Sales Analytics Image 2
The screen shows an account segmentation dashboard built with Board
  • Easily categorize your customers

    Define your customer base in terms of needs, preferences, key buying factors, business attributes (i.e. industrial sector, size, and country), and commercial key performance indicators (i.e. volume growth, cross selling results, and gross margin increase)

  • Get help from algorithmic segmentation

    Perform customer segmentation by applying Board’s native K-means clustering algorithm to your data set, deciding the number of groups and the “similarity criteria” of the groups to suit your requirements

  • Spot sales insights

    Extract business insights from data mining activity and use them detect sales patterns within customer segments

Gain forward-looking insights with predictive sales analytics

Take advantage of sales predictive analytics within a machine learning environment to detect where sales growth is more easily attainable in order to focus sales force effort.

  • Foster your data forecasting ability

    Use Board’s analytical suite to automatically generate projections of sales volumes, revenues, and any kind of commercial key value driver, exploiting the power of predictive analytics within a machine learning environment

  • Make the most out of a human and machine approach

    Track the history of forecasting sessions on analogous data sets (i.e. first quarter sales volumes, annual revenues, weekly orders flow), compare Board’s predictive analytics tool against managerial judgement in terms of forecasting accuracy, and commit to a machine or human approach for each data set as a result

  • Integrate your analytics capabilities

    Easily acknowledge your in-house analytics (i.e. proprietary algorithms created in R and Python) and exploit the benefits of integration into the Board platform

Sales Analytics Image 3
The screen shows how Board's statistical capabilties can be used to improve forecast accuracy

Boost the conversion rate from lead to deal

Take advantage of a pipeline analysis and inspection tool to identify where to focus your attention.

Sales Analytics Image 4
The screen shows how Board's predictive capabilities can be applied to sales forecasting, modeling the probability of opportunities
  • Achieve end-to-end transparency of the sales pipeline

    Easily detect where your sales qualified leads are in the buying journey and quantify sales opportunities across different stages

  • Monitor KPIs with ease

    Calculate a set of KPIs relative to sales opportunities such as conversion rates, deal closing probabilities, and time to close based on historical data

  • Focus your sales efforts

    Prioritize sales opportunities in terms of deal closing probability, expected close date, size, and profitability, and drive sales force effort towards more promising opportunities

  • Enhance sales planning activities

    Support the sales planning process, and in particular quota and territory planning activity, with pipeline information relative to opportunity conversion into sales, split by relevant drivers such as market, geographical area, territory, and rep

Easily monitor your sales metrics

Exploit KPIs using the best sales analytics tools and analytical functions contained in Board to extract business insights from your commercial data set.

  • Uncover patterns in customer purchasing behavior

    Find relevant sales patterns within your historical commercial information by leveraging a set of indicators native within the platform, relative to customer buying behavior such as nascency, frequency, recency, monetary, and dormancy

  • Quickly perform in-depth analyses

    Take advantage of a range of mathematical and statistical functions, from standard min/max/average/weighted average, or more sophisticated linear regression, multiple linear regression, Holt-Winters, and other proprietary algorithms

  • Track evolution of key value drivers

    Build up key value drivers and sales metrics to measure the effectiveness of your commercial efforts. Track their evolution, analytically plugging in all necessary adjustments to sterilize M&A transaction bias, new point of sale openings and closures, new customer acquisition, and customer portfolio reallocation among reps

Sales Analytics Image 5
The screen shows an example of a sales dashboard built with Board that monitors the most important sales metrics
Sales Analytics Image 6

End-to-end sales analysis, reporting, and control

With Board, Mitsubishi Electric has achieved real-time access to accurate data which is automatically consolidated from various sources, reducing sales and order analysis from a 10-hour process to just two seconds.

Explore more of Board’s sales performance management capabilities

Sales Planning

Enhance sales budgeting, quota and territory planning, and sales forecasting processes

Learn more

Sales Analytics

Foster sales analytics capabilities and extract business insights from data

You are here

Incentive and Compensation Management

Automate the process of planning, analyzing, and managing sales force incentives and compensation

Learn more

CRM Integration

Unleash all the value of your CRM data to drive better sales planning and analytics

Learn more