This website will offer limited functionality in this browser. We only support the recent versions of major browsers like Chrome, Firefox, Safari, and Edge.
Why Getting the Plan Right from Day One Makes or Breaks Your IBP Implementation in Consumer Goods
Most IBP rollouts fail from day one because plans rely solely on internal data. Learn the external indicators that predict demand and how to wire them into your planning cadence.
The most expensive integrated business planning (IBP) mistakes aren’t bad technology. They’re starting with the wrong inputs and building static plans in a dynamic world.
I’ve sat across from finance heads and supply chain leaders in consumer goods who are deep into or just finishing an IBP implementation. The technology is live. The process cadence is set. The S&OP meetings are on the calendar.
And yet the forecasts still feel like guesswork.
When I dig in, the root cause is almost always the same: the planning framework was built entirely on internal data. Historical shipments. Retail POS trends. Last year’s trade promotion calendar.
It’s a plan that looks backward while trying to see forward.
In today’s environment, that’s no longer enough. Economic volatility, consumer sentiment shifts, channel migration, housing cycles, and inflation shocks move faster than internal shipment data can reflect. If IBP is meant to enable confident, cross-functional decisions, it must be grounded in both internal performance and external reality.
The dirty secret of most IBP rollouts is that the data strategy is an afterthought, decided after the process design, after the tool selection, and after the go-live date. By then, it’s too late to build the right foundation.
Internal Data Tells You What Happened. External Data Tells You What’s Coming.
Your internal data is invaluable. It tells you how your SKUs perform across channels, what your cost-to-serve looks like, how promotions lift volume, and where your production capacity sits. It is the essential baseline.
But internal data is, by definition, a lagging signal. It reflects decisions that have already been made, demand that has already materialized, and markets that have already moved.
This is why leveraging external signals must become essential. Before forecasts can be modeled, organizations need a structured view of macroeconomic, market, and category-level indicators that shape demand before they appear in internal data.
This is especially true in consumer goods IBP, where demand is shaped by forces well outside your four walls: consumer sentiment, real disposable income, housing activity, private label competition, and shifting channel preferences between grocery, mass, and e-commerce.
Let’s consider two very different consumer goods categories:
Food & Beverage:
A food manufacturer’s volume is tightly correlated with indicators like Advance Retail Sales: Food and Beverage Stores, Personal Consumption Expenditures for Food at Home, and consumer spending forecasts for grocery staples. When real disposable incomes compress and consumer confidence softens, households trade down, shifting from branded to private label and from restaurants to at-home eating. These signals are visible in external data 3 to 6 months before they show up in your shipment trends.
Your retail buyers already know. Your plan should too.
Bedding & Home Textiles:
A bedding company’s demand story runs through a completely different set of drivers, including housing starts, existing home sales, and consumer spending forecasts for hardlines such as linens, bedding, and draperies. When the housing market cools, discretionary home goods typically feel it 6 to 12 months later as the pipeline of new homeowners furnishing their spaces dries up. Conversely, a housing recovery is one of the most reliable leading indicators of a bedding demand upturn, but only if your plan is watching for it.
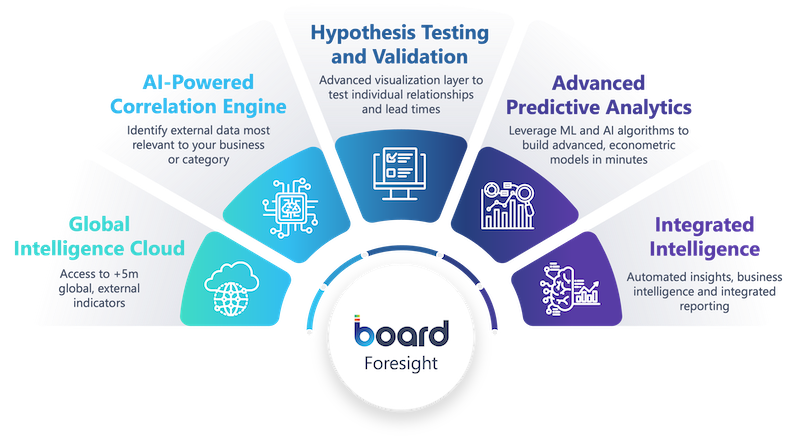
These aren’t hypothetical relationships. Enterprise planning capabilities like Board Foresight provide access to over 5.5 million economic indicators, from weekly consumer spending levels at food and beverage stores to 90-day consumer spending forecasts for hardlines segmented by household income and demographic.
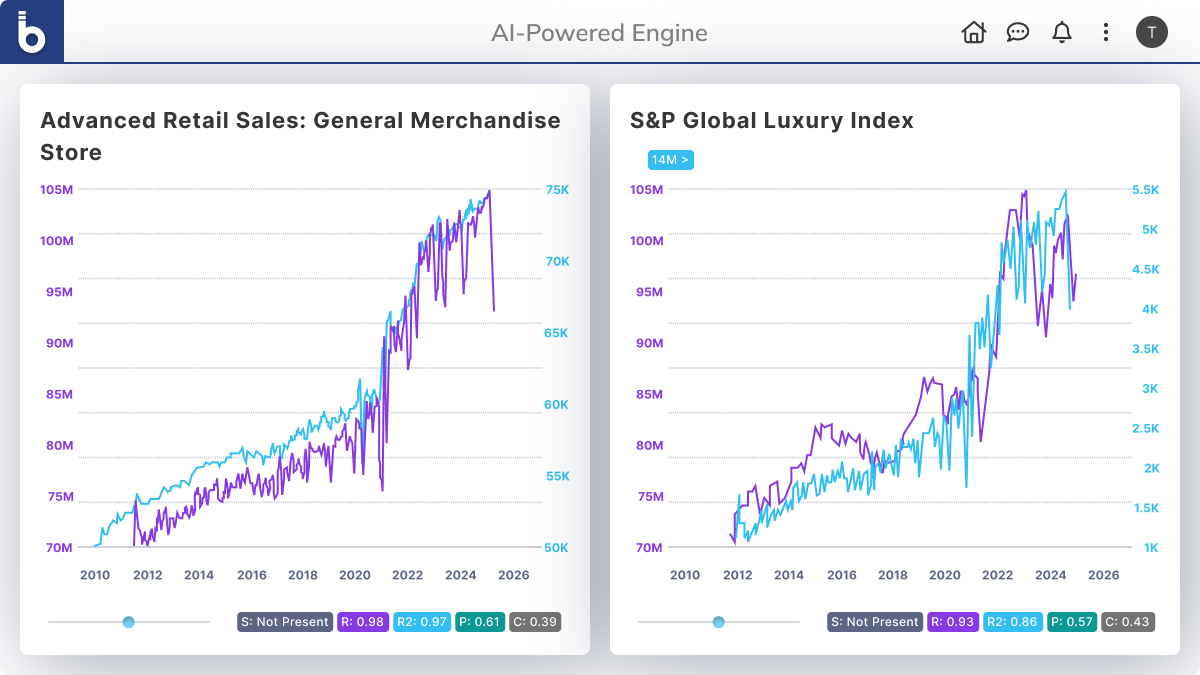
Through Board’s Correlation Engine, these indicators are systematically tested against your internal shipment and revenue history to find which external signals genuinely predict your business outcomes, and by how much lead time.
But insight alone is not enough. Those insights must operate inside the same governed planning models that drive confident finance, supply chain, and commercial decisions.
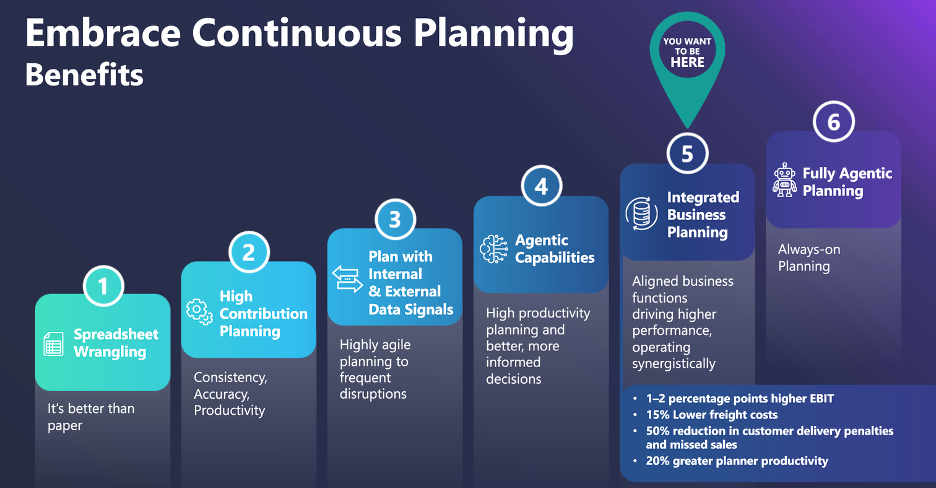
This is the true difference between a reactive plan and a predictive one, and between a static IBP rollout and continuous planning.
The Cost of Starting with the Wrong Plan
Here’s what I see happen when consumer goods IBP implementations skip this step:
The consensus number becomes a political number. When the only inputs are internal, such as last year’s actuals, the sales team’s account-level forecasts, and capacity plans, the IBP process becomes a negotiation between functions instead of fact-based alignment. Without an external signal to anchor the conversation, the consensus reflects organizational dynamics more than market reality. Finance wants a conservative number, sales wants a number that unlocks trade spend, and supply chain needs a stable number to manage contract manufacturing. This external anchoring is crucial to providing a unified, shared reference point that grounds discussion in objective context.
Seasonal plans miss the turn. Bedding is a highly seasonal category, with demand concentrated around key retail moments. But the underlying demand signal isn’t just the calendar. It is how many households are in formation. Housing data leads bedding demand. If your plan doesn’t incorporate housing starts, new home sales, and mortgage application data, you’re flying seasonal without a weather forecast.
Promotions get planned into a vacuum. In food and beverage especially, promotional planning is a major driver of the annual volume plan. But if you’re not incorporating external signals such as real income trends, consumer confidence, and channel shift dynamics, you’re building your trade calendar on assumptions that may no longer hold. A promotion designed for a consumer who is spending freely performs very differently when that same consumer is watching every dollar. When planning is continuous and externally informed, promotions can be adjusted as signals shift rather than locked in months in advance based on outdated demand assumptions. This is exactly why “trade promotion planning” can’t be disconnected from the external drivers shaping shopper behavior.
Scenario planning has no external anchor. IBP is supposed to enable scenario analysis. What happens to our plan if volume softens 10 percent? But if your baseline isn’t grounded in external market drivers, downside and upside scenarios are equally unanchored. You end up stress-testing assumptions built on assumptions. By contrast, when forecasts are built on explainable correlations between internal performance and external signals, scenarios become defensible to finance leadership, executive teams, and even boards. This shifts IBP from “what do we think?” to “what do the signals tell us?”
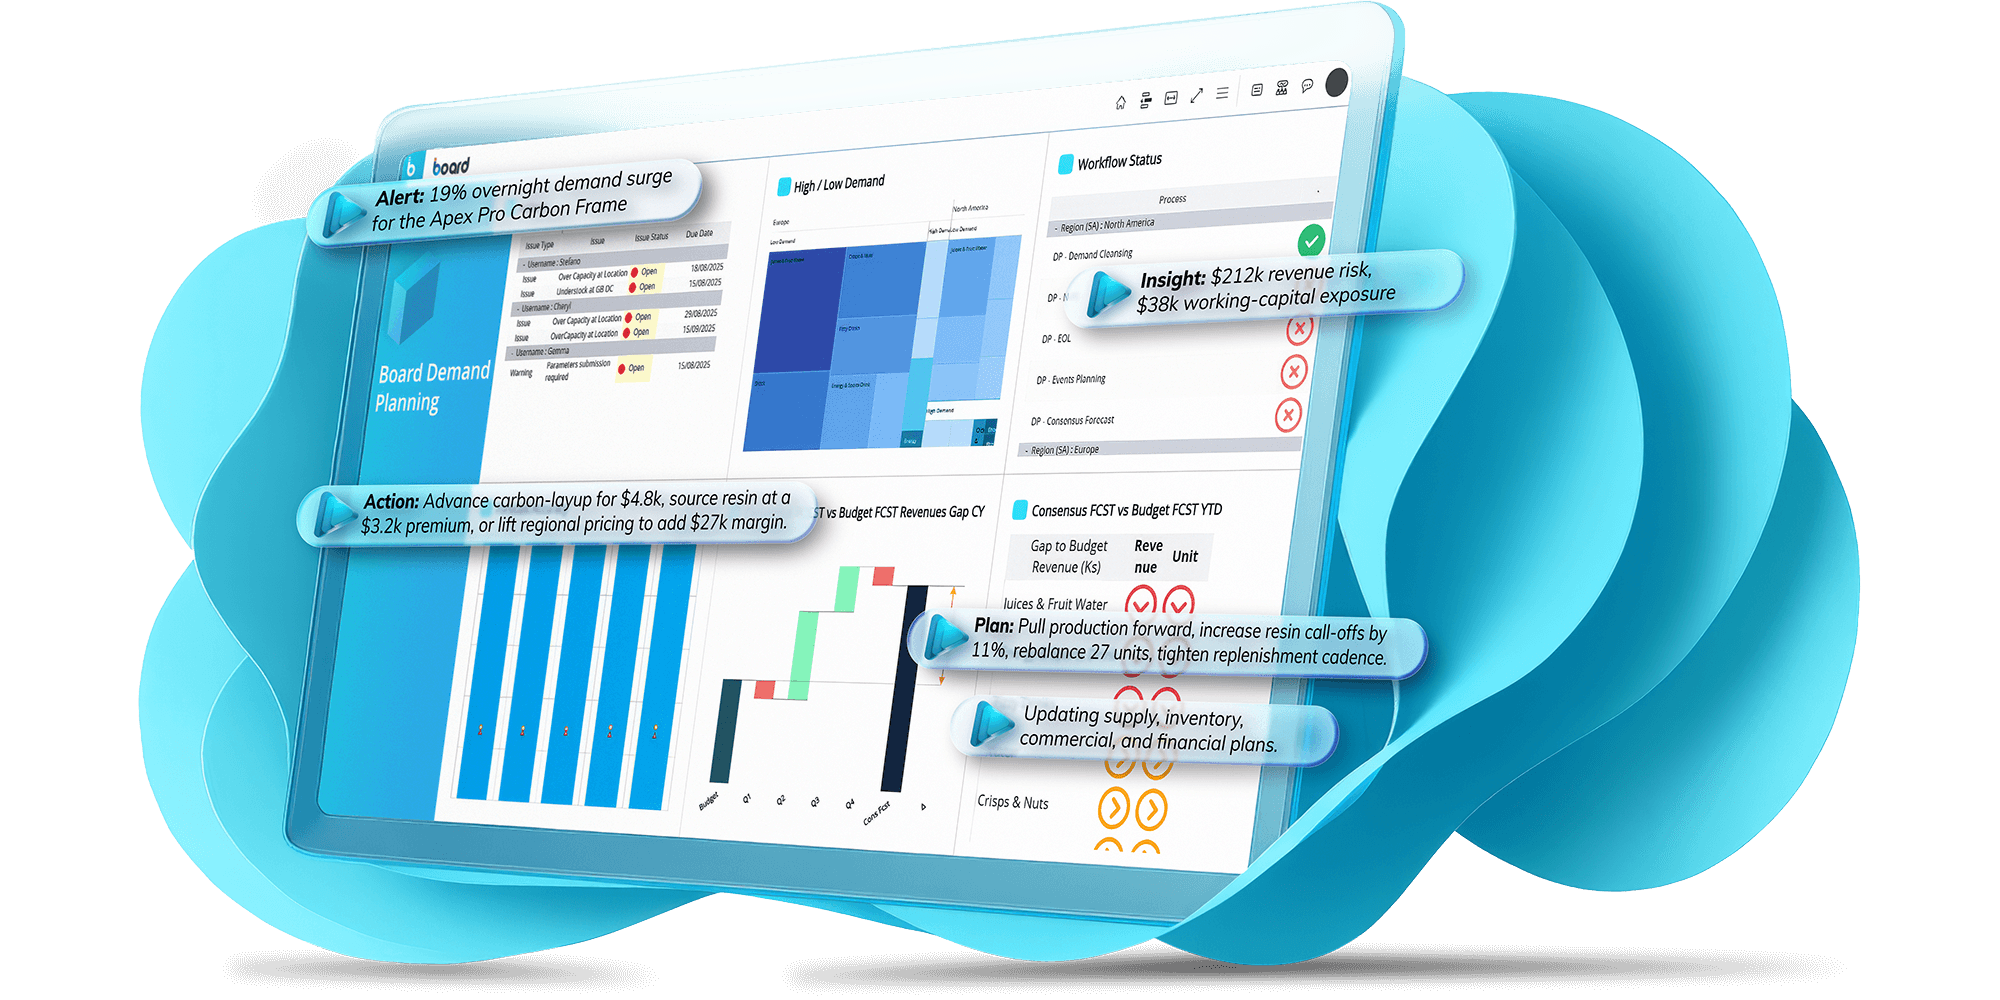
The plan goes stale within weeks. Consumer sentiment moves. Grocery inflation spikes. A housing correction accelerates. An IBP process without external data integration has no mechanism to capture these signals until they’ve already hit your shipments. Without continuous monitoring, your plan only updates when someone manually intervenes. That’s why our new Board Agents, persona-based and domain-specific AI agents, change that dynamic by continuously reading forecasts, ingesting new signals, and surfacing plan drift early. This enables IBP to operate as a living system rather than a monthly ritual.
The fix is simple (but not easy): treat external signals as a governed input to your monthly cadence, not a one-time annual exercise
Building the Right Foundation for Consumer Goods IBP
Starting with the right plan means doing the indicator work before go-live, ideally before the process design is finalized. Here’s the framework I’d recommend for consumer goods companies:
IBP External Signals Implementation Checklist
Define your category demand drivers (don’t default to generic macro).
Test lead and lag correlations at 3/6/9/12 month intervals.
Choose a short list of “explainable” drivers (not just statistical fits).
Assign ownership: who monitors, who interprets, who acts.
Wire signal review into every monthly IBP cycle (and weekly where needed).
Step 1: Map your demand drivers by category.
Food and beverage demand is governed by different macro forces than home textiles. Grocery volume is tightly tied to real income, consumer confidence, and food-at-home spending rates. Bedding and home textiles track housing formation, home sales turnover, and discretionary hardlines spending intent. Be explicit about which economic forces actually govern your category. Do not default to generic macro indicators.
Step 2: Run systematic lead and lag correlation analysis.
For each candidate indicator, test the relationship against your internal shipment and revenue data at multiple time lags, such as 3, 6, 9, and 12 months. For food manufacturers, you’re looking for 3 to 6 month lead signals. For bedding companies exposed to housing cycles, meaningful lead times of 6 to 12 months are common. The goal is to identify which signals are genuinely predictive versus coincidental.
Step 3: Segment indicators by planning horizon.
A 12 month annual operating plan needs different external inputs than a 3 month rolling forecast. Strategic planning for a bedding company might watch housing permits and mortgage rates. Near-term operational planning might watch weekly consumer spending levels at key retail channels. Build your indicator framework with this two-horizon structure from the start. Importantly, with Board, both operate within the same shared planning model across departments.
Step 4: Build channel dynamics into the model.
Consumer goods IBP has a complexity that industrial businesses don’t. The same consumer demand signal plays out very differently across mass, grocery, club, and e-commerce channels. External consumer spending forecasts segmented by household income and demographics, available in Board Foresight down to specific retail category and consumer segment, allow you to anticipate channel mix shifts before they appear in your shipment data.
Step 5: Wire external data reviews into your monthly IBP cadence.
External data should not be a one-time annual input. When consumer sentiment, housing data, and retail spending signals update monthly or weekly, your planning process should incorporate them and adapt in rhythm with the market. When a key indicator moves materially, your cross-functional team should have a standard process for evaluating what it implies for the consensus forecast.
The IBP Promise, Actually Delivered
IBP promises a single integrated view of the business that unifies finance, supply chain, sales, and operations around a common plan. That promise is genuine and achievable, but only when the plan is built on the right foundation.
For consumer goods companies, that foundation has to include the external signals that govern consumer demand. A food manufacturer that isn’t watching real disposable income trends and consumer spending forecasts for grocery staples is leaving its most important leading indicators off the table. A bedding company that doesn’t incorporate housing data into its IBP framework is planning without its most reliable demand signal.
External economic data shifts the IBP conversation from “what do we think will happen” to “what are the external signals telling us, and what does our plan need to reflect.” That’s a fundamentally different and more productive conversation for your cross-functional leadership team to be having every month.
The companies that get the most out of their IBP investments are the ones that treated the data strategy as the core of the implementation, not as a Phase 2 add-on. They built their external indicator frameworks before go-live. They trained their planning teams to read external signals alongside internal performance data. They wired economic data reviews into their monthly S&OP cadence from day one.
The technology is table stakes. The data strategy is the differentiator.
FAQs
An external signal is a leading indicator outside your company – like consumer spending, confidence, inflation, or housing – that helps predict demand before it appears in shipments or POS.
Start with 15-30 candidates, then narrow to a short list of the few that consistently lead your demand by a useful time window.
Food-at-home spending, real disposable income, and consumer confidence are common leading drivers – especially when shoppers trade down or shift channels. But the Board Foresight Global Intelligence Cloud will determine the most appropriate signals for your specific business and scenario models.
Housing starts, existing home sales, and other housing-cycle indicators often lead demand by 6–12 months. But the Board Foresight Global Intelligence Cloud will determine the most appropriate signals for your specific business and scenario models.
Assign ownership, define thresholds for “material movement,” and make signal review a standard step before consensus decisions – not an optional appendix.