What is Variance Analysis?
What is Variance Analysis?
Variance analysis is the process of comparing actual performance against budgeted, planned, or forecasted results to identify differences and understand the reasons behind them.
Variance Analysis Explained
Variance analysis helps organizations move beyond simply reporting results to understanding what actually drove performance. It highlights where outcomes differed from expectations and gives finance and business leaders a way to investigate why.
In practice, variance analysis is used to compare actual revenue, costs, margins, cash flow, demand, or other operational measures against a benchmark such as budget, forecast, prior period, or target. The goal is not only to identify whether performance was better or worse than expected, but to uncover the operational or commercial drivers behind the difference.
For example, if revenue comes in below plan, variance analysis helps determine whether the shortfall was caused by lower sales volume, pricing pressure, delayed deals, weaker regional performance, or another factor. Similarly, if costs exceed budget, the analysis may reveal whether the increase was driven by labor, materials, logistics, inflation, or unexpected business activity.
Variance analysis is a core part of FP&A, but it is also relevant across supply chain, operations, retail, and executive planning. It enables organizations to understand performance in context and take corrective action more quickly.
Modern planning platforms such as Board help organizations automate variance analysis by connecting financial and operational data, enabling users to move from summary-level results into detailed drivers and dimensions. This creates a more scalable and actionable approach than relying on disconnected spreadsheets or static reports.
Why Variance Analysis Matters
Variance analysis helps organizations:
- Understand the drivers behind overperformance or underperformance
- Identify risks and opportunities earlier
- Improve accountability across teams and business units
- Support faster, more informed decision-making
- Refine future budgets and forecasts based on actual performance patterns
Without variance analysis, organizations may know that results changed, but not why. That makes it harder to respond effectively or improve future planning.
Variance analysis is especially important in complex organizations where performance may shift across products, channels, regions, or business units. In these environments, understanding the source of deviation is often more valuable than the headline result itself.
How Variance Analysis Works
Compare Actuals to a Benchmark
The process starts by comparing actual results against a reference point such as:
- budget
- forecast
- prior year
- prior month or quarter
- target or strategic plan
The benchmark depends on the business question being asked. A comparison to budget may focus on execution discipline, while a comparison to forecast may focus on near-term predictability.
Quantify the Variance
Once the comparison is made, the organization measures the size of the gap. Variances may be expressed:
- in absolute terms, such as revenue being $2 million below plan
- in percentage terms, such as costs running 6 percent above forecast
This helps teams prioritize which areas need investigation.
Analyze the Drivers
The most valuable step is breaking the variance down into its underlying causes. Examples include:
- price vs volume
- mix changes across products or regions
- timing issues
- external market shifts
- operational inefficiencies
- one-time events
Driver analysis turns a high-level variance into an actionable business insight.
Interpret and Respond
The final step is using the findings to inform decision-making. Depending on the result, an organization may:
- revise forecasts
- reallocate resources
- adjust pricing or promotions
- change production plans
- investigate operational issues
- communicate performance risks to leadership
Variance Analysis vs Performance Reporting
Variance Analysis | Performance Reporting |
Explains why results changed | Shows what the results were |
Focuses on drivers and causes | Focuses on outcomes and metrics |
Supports action and decisions | Supports monitoring and visibility |
Often cross-functional | Often summary-based |
Performance reporting is essential, but variance analysis adds the layer of interpretation that helps organizations respond intelligently.
Examples in Practice
Finance Example
A finance team sees that operating expenses are above budget. Variance analysis shows the overspend is primarily driven by contractor costs in one region rather than a company-wide trend. This allows leadership to address a specific issue instead of applying broad cost controls.
Supply Chain Example
A manufacturer finds gross margin below forecast. Variance analysis reveals that freight and raw material costs rose faster than expected, while production volume remained stable. The business can then decide whether to adjust sourcing, pricing, or inventory strategy.
Retail Example
A retailer reports lower-than-expected revenue for the quarter. Variance analysis shows that footfall remained strong, but conversion and average basket size declined in selected stores. This points to a merchandising or promotion issue rather than a traffic problem.
Executive Planning Example
Leadership reviews quarterly performance and finds profit below plan despite solid top-line growth. Variance analysis shows that margin erosion came from an unfavorable product mix and increased discounting, helping shape the next planning cycle.
Key Benefits
- Better visibility into what is driving performance
- Faster identification of issues that need action
- Improved collaboration between finance and business teams
- Stronger forecasting and planning over time
- More confident decisions based on evidence, not assumptions
Related Terms
FAQs
See how Board transforms variance analsis
Board’s planning, budgeting, and forecasting software streamlines financial processes, speeds up reporting cycles through automation, and ensures accuracy with real-time data integration.
Explore Board's PB&F solution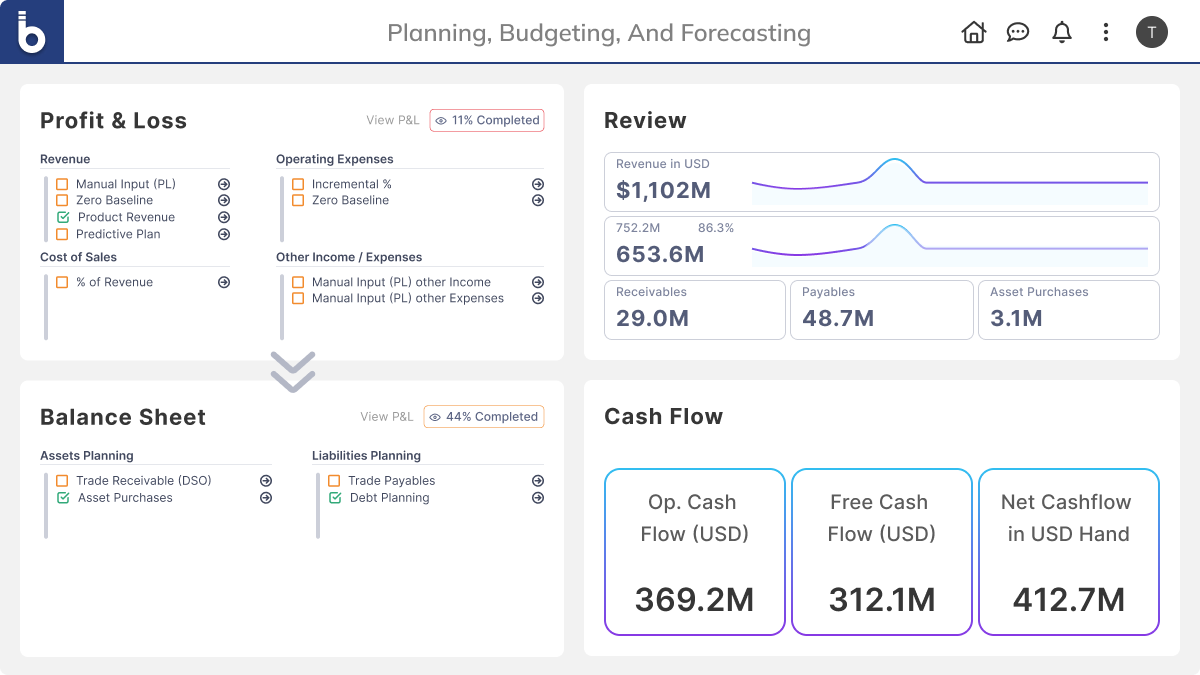

Let’s see what Board can do for you.
Get a tour of the Enterprise Planning Platform in action.