
Working in an industry with long production times and varying crop yields, Biobest faces a complex balancing act between production capacity and demand. The business overcame this challenge by replacing disparate spreadsheets and systems with the Board Intelligent Planning Platform, benefiting from inbuilt predictive analytics capabilities provided by Board Enterprise Analytics Modeling (BEAM). Now, Biobest has a single point of truth for all data and one platform from which to drive the global production process, enable customers and distributors to contribute data directly to plans and forecasts, and help the organization assign demand to available production capacity effectively.
Using historical sales data, BEAM will search for trends that it can use to forecast our future demand.
Luc Buntinx
Biobest Group is a global leader in integrated pest management, biological control, and pollination. Providing a green alternative to pesticides, the company rears beneficial insects and mites used by farmers to protect their crops against diseases and sells bumblebees for pollination purposes.
Founded in 1987 and headquartered in Belgium, the company has 25 subsidiaries worldwide. Innovation and product quality are at the heart of Biobest’s activities, and the company prides itself on providing tailored advice and technical support for farmers.
The Challenge: Effectively balancing production capacity and demand
In striving to achieve its mission of being the most reliable supplier of bumblebees and crop protection products, Biobest faced several challenges. Long production times of up to 16 weeks, fluctuating levels of demand, and variations in crop yields due to their biological nature created a complex balancing act between available production capacity and demand.
“Our customers place their orders just a couple of days before receiving their goods, so the big question is, how much should we produce? We don’t want to let our customers down, so high availability is key, but harvests that are too big will create waste and lead us to incur unnecessary costs. We want to avoid this to ensure our products remain affordable. As an environmentally friendly company, we want to protect our resources too,” explains Luc Buntinx, Business Application Manager at Biobest.
The Solution: A single platform for organization-wide planning and forecasting
As a solution to these challenges, the Biobest team chose to implement the Board Intelligent Planning Platform, which unifies business intelligence, planning, and predictive analytics capabilities in a flexible, highly customizable environment.
“Board was to function as a communication platform to gather, transform, and exchange the necessary data with all our stakeholders in the global supply network,” continues Luc. “We wanted to have the right information at the right time to make decisions and guarantee high delivery performance. Board is very powerful in calculating aggregations and breakdowns. You can, for example, perform data entry, and on-the-fly it will recalculate aggregations and breakdowns in a few seconds. During our evaluation process, we didn’t see many tools that were capable of doing that. It was one of the key reasons we chose Board.”
Biobest sought to move away from treating each subsidiary as a separate business entity, using Board to create a holistic, integrated approach across the entire organization.
“We wanted a good view of total demand inside the group but also the total available capacity at all times. For example, a sudden increase in demand in a certain market could be fulfilled with available capacity that has been freed up by a sudden decrease in another market. We don’t want to lose these opportunities, so it is essential to get the information at high speed and at the right moment to make the right decisions.”
Decreasing administrative workload through automation was another critical objective of the project, as Luc continues:
“The balancing of supply and demand was a very laborious process, so we wanted to automate it where possible to free up our resources for other activities. The Commercial team, for example, could use that time to investigate markets and gather more information to enrich and increase the accuracy of their forecasts.”
The Project: Capacity and demand planning at a global level
Using Board with the support of the implementation partner XB4 Consulting, Biobest has successfully balanced capacity with demand in a fully integrated, five-stage process:
- Initializing the process with system-built forecasts
- Collecting the demand and available production capacity figures at a global level
- Aggregating and breaking down forecasts at different levels of granularity
- Allocating available production capacity to demand
- Measuring and evaluating forecast accuracy
Stage 1: Initializing the process with system-built predictive forecasts
Board Enterprise Analytics Modeling (BEAM), an integral feature of the Board platform that uses automated predictive modeling capabilities to produce accurate forecasts at speed, drives the initialization of the process. BEAM provides a baseline for all of Biobest’s forecasts, as Luc explains:
“Using historical sales data, BEAM will search for trends which it can use to forecast our future demand. This provides a useful first step for our Commercial team, who will review the forecasted trend and adapt it where necessary to produce their final forecast. Eventually, when the actuals come in, we can evaluate the accuracy of the forecasts from both Board and the users themselves.”
Stage 2: Collecting demand and capacity figures at a global level
At the next stage, the local Commercial teams enter their final forecasts into Board, beginning with the forecast generated by BEAM and using a screen that displays previous and current year actuals for sales and demand. The screen can be filtered with ease, enabling teams to quickly see and edit the information related directly to their region or product range.
“The Commercial team can adopt the system-built forecast and adapt it if they wish. Missed sales opportunities from the past are highlighted in the actuals data for the previous year, and this information can be used to prevent the same issue from happening in the future,” continues Luc.
The Commercial team generates forecasts using customer data, helping improve alignment and better balance capacity with demand. Before Board, the company sent an Excel-based forecast template to customers and distributors to collect this information, but it proved challenging to keep it up-to-date.
“In Board, it’s possible to generate a template containing the latest forecast data. Our customers and distributors will fill it in and send it back, and we can then upload the forecasts into the system. They are keen to participate in this process as it guarantees they will get their product delivered at an affordable price. We’re also taking this a step further; recently, we started a pilot project in which certain distributors have direct access to the Board platform so they can enter their forecasts immediately into our system and review their history with us.”
Besides gathering data on demand, the Biobest team also needs to combine production capacity data from sites worldwide. Each of the production sites enters its best estimate of production capacity, with Board creating a single source of truth for this information to be used later in the production allocation stage.
Stage 3: Aggregating and breaking down forecasts at different levels of granularity
Once the demand and available production capacity figures are forecast at a high level, they are broken down into a lower level of detail, using the concept of a forecast pyramid.
Biobest Forecast Pyramid Approach for each Planning Unit (PU)
“Inside many organizations, there are questions around the level of detail at which you should forecast. We use the concept of a forecast pyramid, where predictability is higher at the top, but the detail is lower, and vice versa. You could decide to build a forecast at the top of the pyramid because it’s easy to come to an accurate forecast, but that would lead to inefficient production plans because it lacks enough detail. On the other hand, if you decide to forecast at too low a level, there would be enough detail, but the predictability is lower, so you end up with inaccurate forecasts which are unfavorable for the production department,” explains Luc.
Biobest uses this concept to identify the optimal level of forecasting aggregation for the production department against three dimensions: week, product group (the type of living component, insect, or mite), and Planning Unit (a commercial division of a Biobest subsidiary).
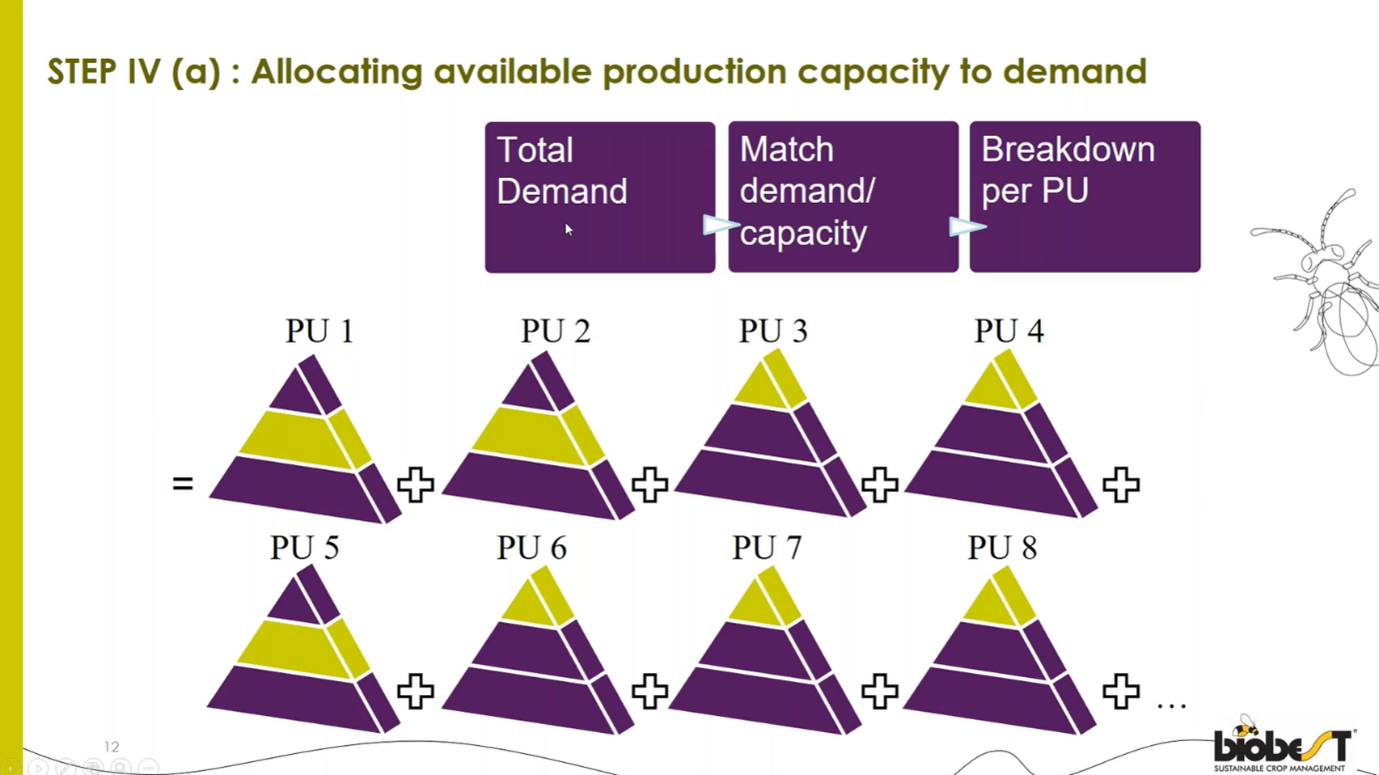
Stage 4: Allocating available production capacity to demand
At this stage, the local demand of each Planning Unit is aggregated to form the total company-wide demand. As part of Biobest’s continued expansion, new subsidiaries are regularly set up or acquired, and the company is keen to integrate them into the forecasting process as soon as possible. For this reason, different Planning Units forecast demand at different levels, depending on their data maturity and forecasting expertise. The flexible nature of Board, and its ability to deal with top-down and bottom-up planning, make it possible to add new subsidiaries and combine all of this multi-level data with ease.
“Planning Units can switch from what we call the ‘simplified setup’, forecasting at the top level, to the ‘standard setup’, which is forecasting at the middle level,” says Luc. “At this point, they will have better insight into their market around why demand suddenly increases or decreases based on certain crops, customers, or periods, for example. They can pinpoint it and use it to improve their demand predictions.”
Once the local demand has been forecasted, it is then combined with production capacity and used to allocate available capacity to the relevant Planning Units.
“With Board, we moved from a decentralized to a centralized approach. The Planning Units forecast their own demand first, which is then aggregated at a central level. We do the same with production capacity, then we have an algorithm in the system that adheres to certain business rules to work out a proposal, allocating the available production capacity of a certain product to certain Planning Units. Eventually, we will know which production site will produce which product for which Planning Unit. This takes place at the top level of the pyramid, but for certain processes, it might be required at a more detailed level. This is no problem; in Board, you can break it down again to the right level, using the ratio generated when executing the forecasting process, or if you want to go a step lower, you can use the sales history.”
At this stage, Biobest knows precisely how many insects or mites each production site needs to produce. The proposal, worked out by the Board platform, is revised by the head office’s management team and adapted where necessary. Biobest refers to this as the “Management Allocation,” and here, Board facilitates the fast sharing of accurate data throughout the business.
“The Management Allocation is sent as feedback to the production sites. They are told whether their initial entry of available production capacity was too high or too low and whether action is needed to increase or decrease it. There are a lot of fluctuations in capacity and demand, so the data changes all the time. For this reason, the frequency of executing the production allocation should be as high as possible to get to the right information and communicate it as fast as possible to production sites, so they can take action to ensure high delivery performance,” explains Luc.
The outcome of this process is uploaded into Biobest’s ERP system to feed the Available to Promise (ATP) and Material Requirements Planning (MRP) processes.
Stage 5: Measuring and evaluating forecast accuracy
Biobest measures and evaluates the accuracy of the forecasts at this final stage. Increased accuracy of the forecast leads to a rise in the accuracy of the production allocation. The team performs this using interactive graphical and quantitative analyses in Board, which can easily be filtered by dimensions such as year, time, Planning Unit, and more.
“In the graphical analysis, if there is a difference between demand and sales quantity (i.e., missed sales), this is highlighted. We also compare factors such as whether the forecast was entered on time (i.e. before the production process), whether a change caused a deviation during the process, or whether there was a backlog between forecast and demand. There are a lot of elements, but this is no problem; in Board, you can deselect certain elements and keep the ones you are interested in for that particular analysis.”
The quantitative analysis, also in Board, provides details of key KPIs such as forecast errors per week or longer-term forecast performance of particular customer groups or area managers. This information is weighted against how big a forecast error was and eventually used to produce an accuracy cumulation for evaluating the commercial team.
“Other KPIs include the Mean Absolute Deviation and the Mean Absolute Percentage of Error (MAPE), which tells you overall how good the forecast was. If this stays constant, it can indicate that the shape of your forecast was maybe not that bad, but that there’s something wrong with the volume. For that, we have a third KPI, which is the TRACK value. This will tell you if the forecast is consistently too high or too low. Then you could, in Board, change the figure for total volume, and it will divide the adjustment over the ratio of the selected period. This is a very nice feature in Board.”
The Next Steps: Widening the project scope
The initial phase of the transformation is now complete. Having realized numerous benefits, Biobest is looking to add more data into Board to improve efficiency further. Luc shares the future direction of the project:
“One of our next steps is to include available production capacity in Board to look at the production yields and statistical control boundaries, to see where we can improve and narrow those boundaries to make it more stable and predictable. These are currently in Excel, and we want to integrate them into Board, with the possibility to change capacity figures based on relevant production yields automatically. We also have the ambition to get our turnover figures into Board, allowing us to calculate average selling prices per market and product and, in the longer term, setting up a budgeting tool in Board. There are several projects in the pipeline and lots more that we can do.”
Luc concludes with some final remarks on his experience with Board, and partner XB4 Consulting:
“Where we once had lots of disparate tools in the past to tackle this process, we now have one, nice, integrated solution for the whole process.” “XB4 is a great team of talented consultants, capable to analyze your business and build the platform that allows you to gather your data and evaluate the performance of your enterprise. After delivery, the quality of service does not finish, but is continuous due to a dedicated team that offers you support when needed.”
About XB4 Consulting
XB4 Consulting is specialized in improving and automating the entire cycle of Corporate Performance Management (CPM) including Strategic Planning, Budgeting, Forecasting, Reporting & Analysis. At XB4, we strongly believe that the era when technical consultants needed functional consultants to translate business challenges into functional specifications is outdated. Today’s consultants must have a dual expertise helping the client to shape first the best practice processes and then automate these into leading technologies. Visit our website to learn more: www.xb4consulting.com