A solution by XB4 Consulting
Drive performance through Sustainability Reporting & Planning.

The Sustainability Reporting & Planning platform enables companies to manage their current CO2 emissions, simulate their best green scenarios possible and track multiple sources of their current CO2 emissions.
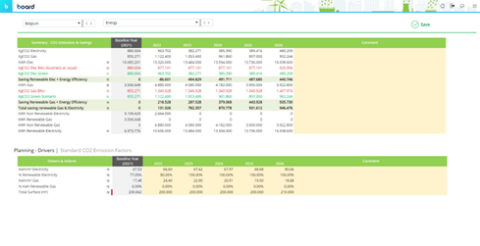
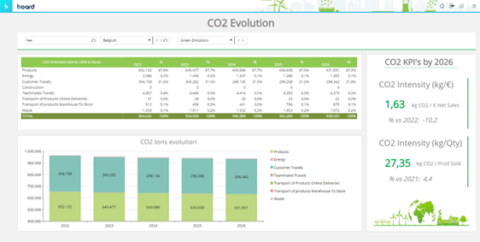
With a simple smart import object, data can be loaded through an excel file in Board for the countries and years of your choosing. The sustainability KPI’s are calculated based on specific drivers and emission factors. Therefore, emissions factors are filled for each country individually or a general emission factor can be used for all countries. (Screenshot 4) When navigating to the CO2 Planning screen (Screenshot 5), future drivers can be manually filled per country, per year and per source. This enables the lower parts of your organisation to fill in emission data in a detailed way, which will result in a correct view of the total CO2 emissions for higher management. The result of the simulated CO2 emissions can be consulted in the CO2 Evolutions screen (Screenshot 6).
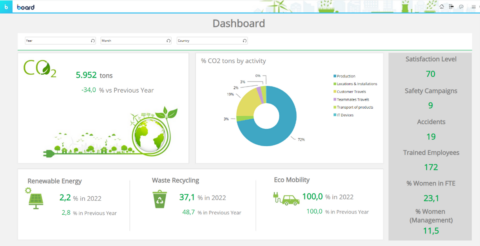
A high level overview of the sustainability performance is provided in the Summary Dashboard (Screenshot 1). This screen aims to visualize the most important sustainability topics of a company, which in this case includes CO2 emissions, renewable energy, waste recycling and ecomobility. A combination of KPI’s, variances and key figures, will give you a clear first impression of the companies overal sustainability performance.
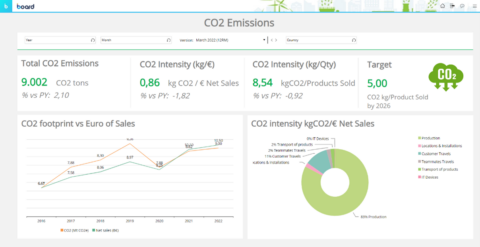
CO2 Emissions can be seen as one of the most important sustainability indicators. Therefore, a seperate screen is created (Screenshot 2) with CO2 emission KPI’s, a CO2 emission target and the contribution per source.
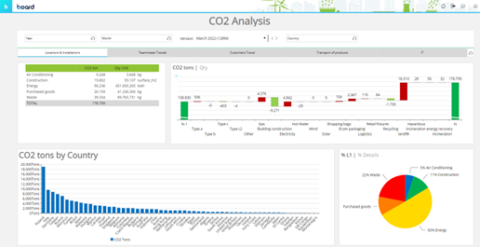
When drilling down on the piechart, you navigate to the “CO2 Analysis” screen with more details (Screenshot 3). In this case, the CO2 review is done quarterly. Therefore, you can switch between a version for each quarter with 12 rolling month logic.
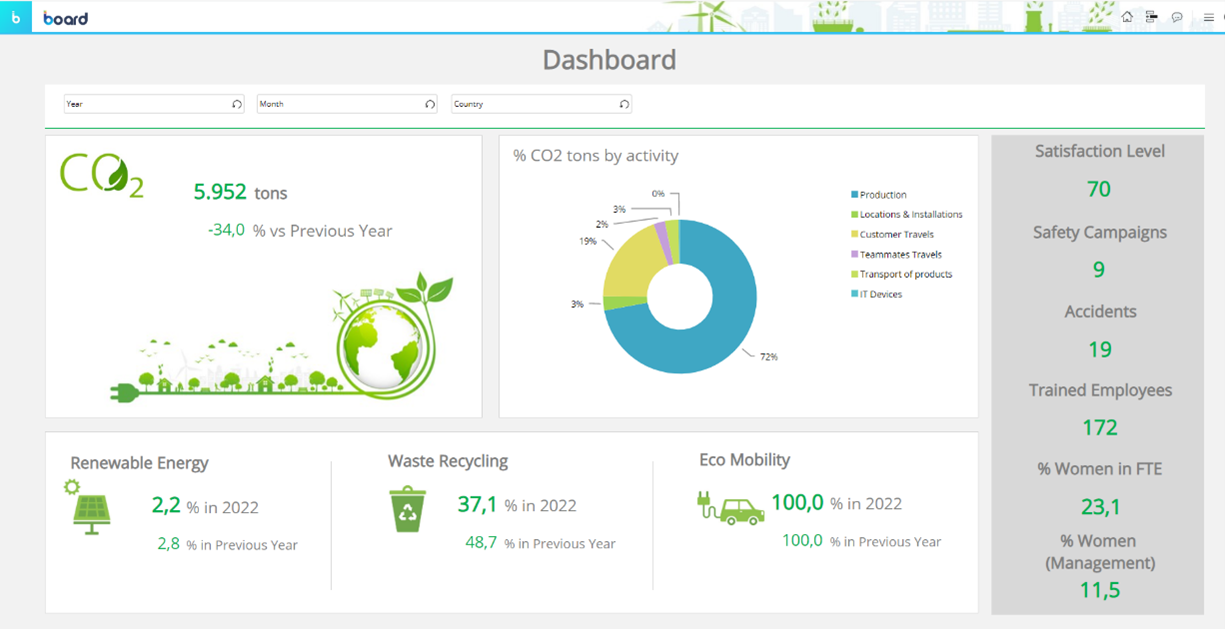
Summary Dashboard: In this Dashboard an overview of the sustainability KPI’s is provided, with CO2 emissions as the main KPI. Switch between aggregated or country specific figures and consult one or multiple years at once.
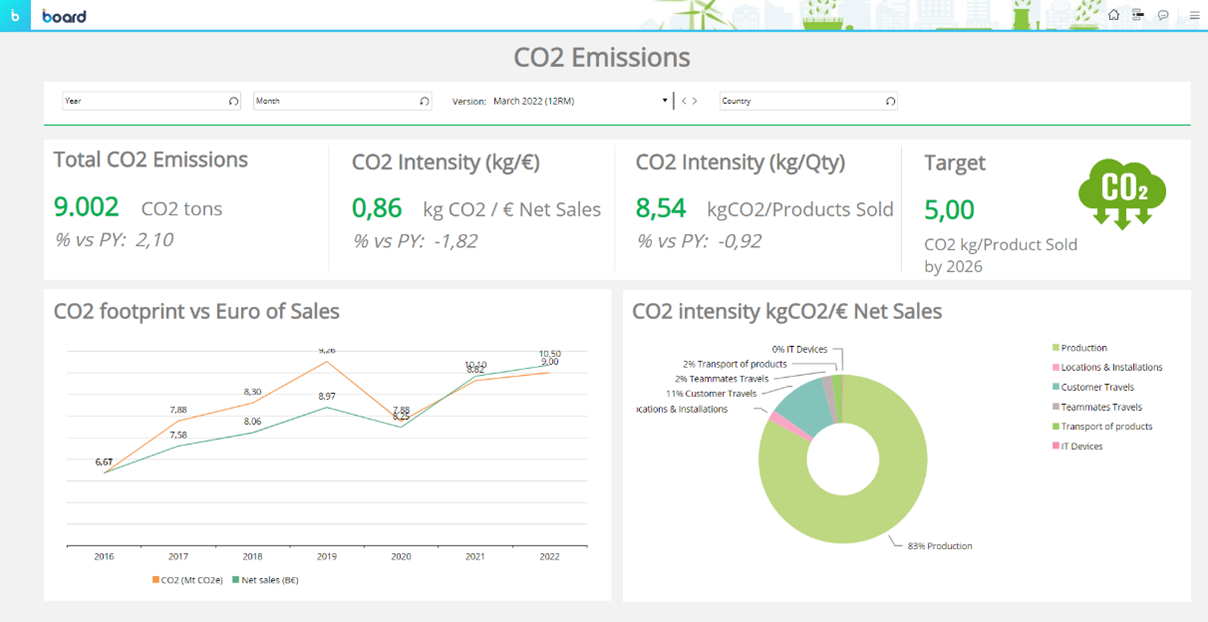
CO2 Emissions: This screen provides details of the CO2 emissions per source, trend analysis/comparison and CO2 emissions KPI’s. In addition, the company specific target is displayed, which indicates that by 2026 the company should decrease the KgCO2/Products Sold from 8,54 to 5. A switch is also possible between different versions. In this case, a quarterly version with 12 rolling month logic.

Performance Analysis: The next screen is an even more detailed view for CO2 emissions. At the top, a tab per source is available, with a table detailing the CO2 ton and quantities. This table functions as a master object for the waterfall by activity, the chart detailed by country and the pie chart per source. Again, a distinction can be made for each version.
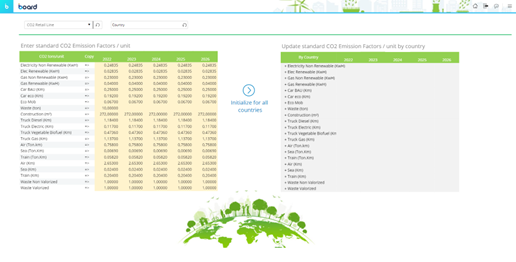
Emission factors: In order to calculate the CO2 Emission, some standard Emission factors are used. This screen provides the opportunity to alter these emission factors for all countries or for each country individually per year.

CO2 Planning: The first table displays the calculated KPI’s based on the drivers which are situated below. A difference is made between business-as-usual emissions and the green scenario emissions. The difference between the two displays the amount that is saved when switching to more sustainable drivers. After altering the drivers below, you can simulate the difference in savings by hitting the save button. A definition and a threshold are provided for each KPI.
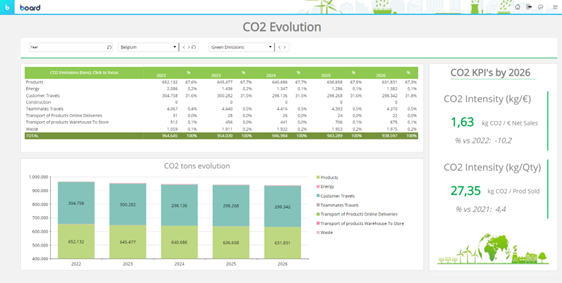
CO2 Evolution: In the table you can consult the total CO2 emissions per source with the contribution of each source to the total CO2 emissions per year. This table functions as a smart object for the graph and CO2 KPI’s.

Want to see this solution in action?
Complete the form and our specialists will be in touch.
Other solutions


Let’s see what Board can do for you.
Get a tour of the Enterprise Planning Platform in action.